Tank monitoring should help you drive down the delivery costs for your business. At Tank Utility, we want to give you better control and insight into these costs with consistent improvements to our Delivery Efficiency Dashboards.
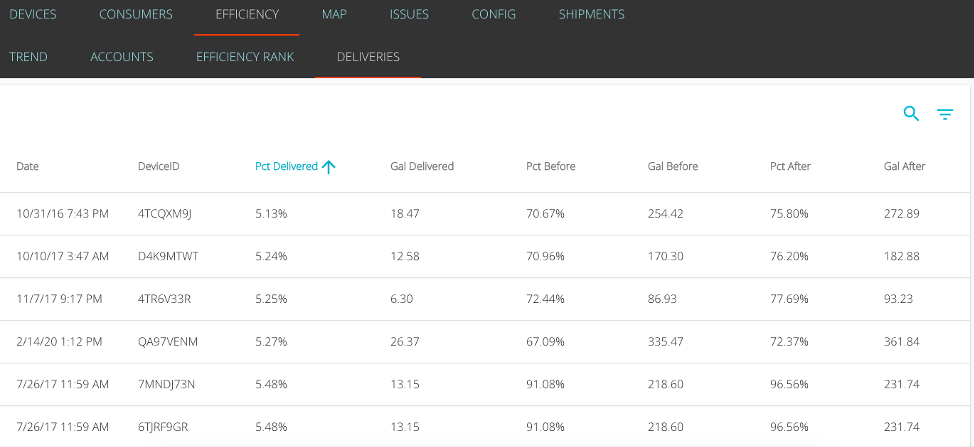
This is a screenshot of the Delivery Efficiency Dashboard for each delivery in Tank Utility.
Analyzing Efficiency Per Account AND Per Delivery
Tank Utility is the only tank monitoring solution where you can see a real-time view of how tank monitoring is positively impacting your delivery efficiency and your bottom line.
Within the Delivery Efficiency Dashboard, marketers can analyze delivery efficiency in the following ways:
- Overall Monthly: This shows the month by month average delivery size by percentage for all tank monitors deployed.
- Account by Account: This shows the average delivery size for each individual monitored account across all historical deliveries.
- [NEW] Delivery by Delivery: This shows every delivery made to monitored accounts and the average delivery size in both percentage and gallons for the delivery.
This detailed view provides fuel marketers with unparalleled insight into the accounts where they deliver too often, helping them to greatly increase margins while reducing overall run-outs. It’s a valuable tool to improve delivery routes and cadences to reduce costs and improve overall team and driver capacity.